
Precision via the Data Bridge Protocol.
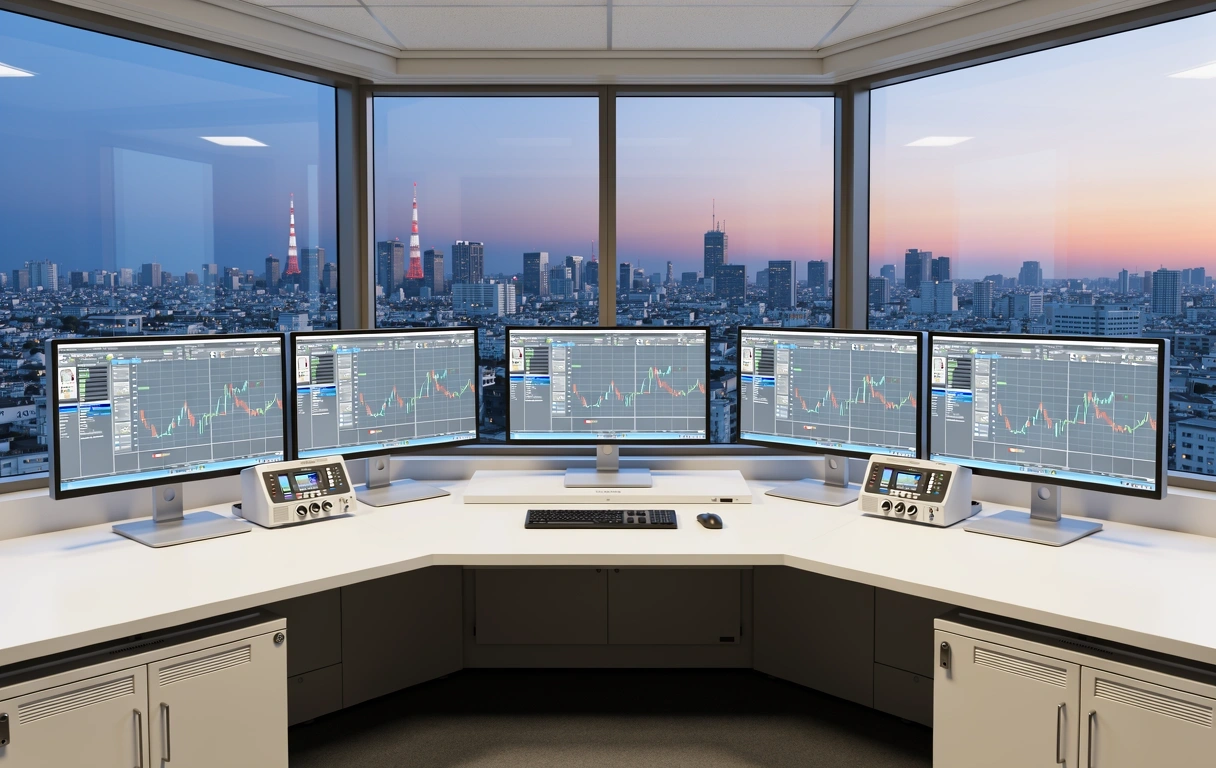
Osaka’s commercial landscape requires more than surface-level observation. We deploy a rigorous suite of market metrics designed to filter noise and isolate high-signal growth indicators for international and domestic stakeholders.

Taxonomy of Insight
Our reporting is built upon three distinct pillars of verification. We do not simply aggregate data; we validate it against local economic realities unique to the Kansai region.
"The bridge is not just an interface; it is a filtration system that ensures every metric served is actionable."
Volatility Adjusted Yields (VAY)
Standard yield reporting often ignores the micro-fluctuations of the Osaka retail and industrial sectors. Our VAY metric applies a proprietary weighting system to seasonal tourism surges and supply chain shifts, providing a smoothed, realistic expectation of long-term returns.
- Seasonality Dampening
- District-Level Granularity
- 2026 Forecast Alignment
Connectivity Index Rating (CIR)
The CIR measures the strength of the "data bridge" between local suppliers and international logistics hubs. By tracking API handshake frequency and transit latency, we quantify the operational efficiency of a business's regional infrastructure.
- Latency Benchmarking
- Node Reliability Scores
- Hub Saturation Data
Sentiment Friction Analysis (SFA)
Quantitative metrics only tell half the story. Our SFA protocol analyzes local market sentiment across Japanese language networks to detect early signs of regulatory shift or consumer trend fatigue before they manifest in traditional financial reports.
- Language Processing
- Trend Fatigue Warning
- Regulatory Momentum
Real-Time Integrity Standards
Data freshness is a non-negotiable metric at Osaka Data Bridge. We maintain a 300ms maximum latency for regional data ingestion. This ensures that the insights you receive are reflective of the current second, not the previous hour.
Our reporting standards comply with the Global Investment Performance Standards (GIPS) while adding a layer of regional specificity required for the Japanese market. We provide full transparency into our source selection, weighting algorithms, and outlier reconciliation.
Sample Metric Interactivity
Compare how our specific metrics differ from standard market benchmarks based on your business sector.
Pedestrian Saturation (Mined)
Real-time foot traffic data from 12 Osaka districts.
Kansai Consumption Power
Adjusted for regional purchasing parity.
*Data refreshed as of 2026-03-17.
Reporting Compliance
We utilize a multi-source validation process for all metrics. Single-source data is rejected. Our bridge logic requires three independent confirming streams (e.g., government statistics, proprietary sensor data, and commercial API scraping) before a metric is published.
Market anomalies are flagged within 60 seconds of detection. Our threshold for publication requires a significance check to ensure that "black swan" events are categorized correctly—either as temporary volatility or long-term structural shifts.
Every data point generated within Osaka Data Bridge is timestamped and cryptographically logged. This allows corporate clients to perform full backward-looking audits of the decision-making data they relied upon at any specific moment in history.
Ready to Bridge the Data Gap?
Contact our advisory team to receive a customized metrics package tailored to your industry and growth goals in the Kansai region.
Location
Osaka 31
Direct Line
+81 6 2000 0031
Operating Hours
Mon-Fri: 9:00-18:00